With the recent release of iDiscover 5.3.2, a new feature has been introduced that supports the export of multiple measured EDX spectra into a single 'sum spectrum'. The QEMSCAN sum spectrum approach is quite powerful in that high-count EDX spectra can now be created over any sample selection/area of interest, with additional SIP-level control in selecting pixels of interest. This approach could be complementing the existing workflow of driving the SEM to a phase of interest located on the mineral map and collecting an online high-count spectrum on the sample. Below, the workflow of both approaches to quantifying the elemental composition of phases of interest measured in QEMSCAN data is detailed.
Targeted high-count EDX spectrum acquisition
The first approach works by selecting a field or particle of interest either in Particle View (iExplorer → Report → Particle View) or the Debug Measurements window (SIP Editor → Tools → Debug Measurements), and driving the SEM stage to the selected area. This requires the measured sample to be located within the SEM chamber, and iDiscover running on the Support PC.
In order to collect a reference spectrum on the sample, iMeasure is opened → Identify Minerals is selected in the tab, and the number of photon counts is set to something like 1,000.000, while toggling off the continuous count option. The measured spectrum can now be saved as either as an
.ems or
.msa file. iMeasure will need to be closed in order to open the
Bruker Esprit software for elemental quantification (see below).
Combining low-count spectra into a single high-count sum EDX spectrum
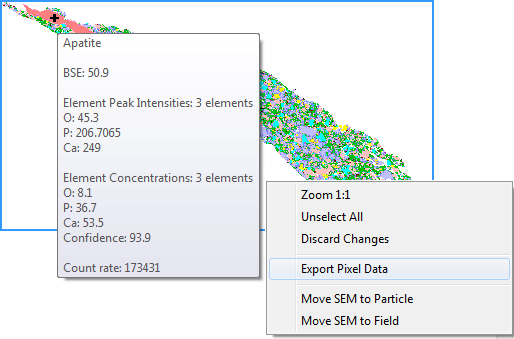
The second approach is combining low-count spectra of a single or multiple phases of interest into a single high-count 'sum spectrum'. This approach can be applied to QEMSCAN data offline if the raw X-rays have been saved at the time of the measurement (Datastore Explorer → New Measurement Setup box → Field Settings → toggle on ‘Save Raw Xrays’). Sum spectra are created within the Debug Measurements window by selecting pixels, particles, fields, or samples of interest, and right-clicking → Export Pixel Data.
 |
| Step 1: Selecting the area from which particular phases are to be combined into a sum spectrum |
Now, a box opens that reflects the individual and combined phases mirroring either the SIP, the Primary Mineral List, or any Secondary Mineral List selected in the above tab in ‘View using:’. In addition to combining measured spectra which have been classified into a phase by a single or multiple SIP entries, all the spectra of the selected area of interest can be combined by using a customized Secondary Mineral List that combines all phases.
 |
| Step 2: Select low-count spectra from selected area reflecting selected SIP, Primary Mineral List or Secondary Mineral List |
Elemental quantification in Bruker Esprit
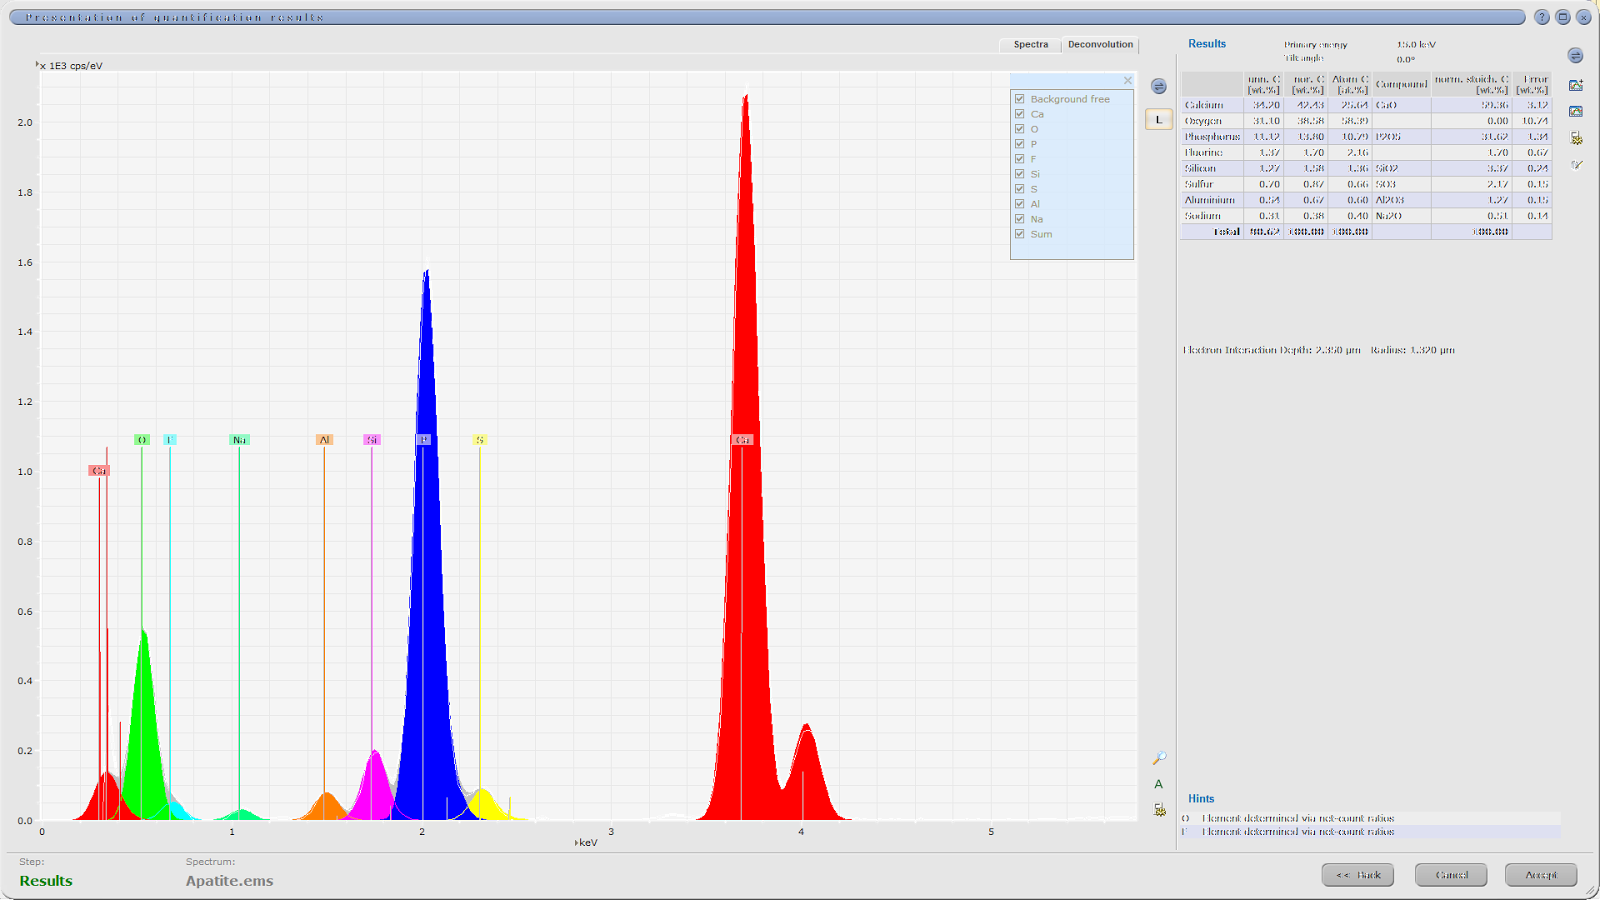
Quantification of the measured or exported high-count EDX spectra is performed in the Bruker Esprit software. The spectrum is opened in the Spectrum module. Elements are identified by using the Esprit Quant Tool (Quant, following selection of methodology – e.g. Interactive Oxides → Continue → Display Periodic Table → Select elements → Continue → check primary energy setting (keV) are correct → background correction (e.g. Automatic) → in options for result presentation toggle on ‘Net intensity’ (photon count without the background) → Accept. Optionally, the data can be exported into Excel (Select spectrum → Export results table).
It is advisable, to run a quality check on the number of photos making up the EDX spectrum by creating the sum of all photons in the ‘Net column’. Note that approximately a third of the photons would have been removed as background.
 |
| Step 3: Semi-quant sum spectrum. The example is based on multiple SIP definitions including boundary phase definitions for the apatite phase in the drill cutting shown above. |


