Thursday, 11 August 2011

Ash from Eyjafjallajokull, S. Iceland 2010

Ash particles from Eyjafjallajökull 2010, analysed by QEMSCAN®
Researchers at the Camborne School of Mines (CSM), University of Exeter, UK, have examined ash samples taken on Iceland during the volcanic eruptions in 2010. Work was undertaken by Dr Gavyn Rollinson and Dr Duncan Pirrie, with samples taken by Dr Stuart Bearhop who was on fieldwork on Iceland at the time of the eruptions.

The ash sample mineralogy reflects the geology of Iceland being dominated by plagioclase feldspar (cyan) and other silicates (olivine, pyroxenes/amphiboles, clays) with glass phases, minor ilmenite and Ti-magnetite. Grain sizes are <30 microns, and generally <15 microns. Initial work was presented by Dr Alan Butcher of FEI at the INQUA XVIII conference in Bern, Switzerland, Saturday 23rd July 2011.

The study demonstrates the value of automated mineralogy to airborne pollution and builds on previous and current work being carried out on air particulates at the Camborne School of Mines.

Saturday, 30 July 2011

QEMSCAN studies of metamorphic rock samples


Identification of key minerals is of great importance to determining the tectonic history of metamorphic samples. These key minerals may be few in number and present only as small micro-inclusions making them difficult to identify, if at all, with a petrographic microscope.


Once relict minerals of earlier metamorphic assemblages are located, thermobarometry and geochronology can then be applied, resulting in a wealth of information on previous segments of the pressure-temperature-time-deformation path. The relict mineral textures and their relationship to the fabric of the entire thin section can be easily seen in mineral maps yielding important textural information.


The QEMSCAN at the Camborne School of Mines (CSM) is being used to study metamorphic samples from the Central Metamorphic terrane of the Eastern Klamath Mountains, Northern California.


Intial results were presented at the European Geosciences Union, General Assembly, Vienna, 2-7 May 2010 "Application of Automated SEM-EDS Based Mineral Identification Systems to Problems in Metamorphic Petrology" by Robert Fairhurst, Wendy Barrow and Gavyn Rollinson.


Friday, 29 July 2011

QEMSCAN Filament Life


Currently the tungsten filament in our QEMSCAN system Camborne School of Mines, University of Exeter, UK has been running for 6376 hours (since 15th December 2011) which is well over 8 months. Is this a record for tungsten filaments? Comments welcome on life spans of your filaments!

QEMSCAN: Beyond Minerals


Automated Mineralogy can characterise more than just minerals. At the Camborne School of Mines (CSM), University of Exeter, UK, we have been experimenting with a wide range of sample types for over 7 years. To the left is an example of a historical smelter slag (from historic mining activity pre-1900's) taken from Calenick Creek, near Truro, Cornwall, UK.

The image shows mainly Fe-As (blue) and Sn metal (red) phases, and identified various other phases. Sample size is approx. 4 x 2 cm, fieldscan mode at 10 microns resolution with about 2 million analysis points.

TOP 10 AM papers: Riley et al. 1989, Hydrobiologia 176/177, 509-524

QEMSCAN mineral map of fluvial sediments collected from the 2010 Brisbane flood
Review of Riley et al. 1989, Hydrobiologia 176/177, 509-524

In terms of early adopters of automated mineralogy technology beyond mineral processing, due credit must be given to Riley, Creelman, Warner, Greenwood-Smith and Jackson from Australia. In their groundbreaking journal paper on "The potential in fluvial geomorphology of a new mineral identification technology (QEM*SEM)" they pioneer the application of automated SEM-EDS compositional mapping to the study of depositional environments and sediment sources. I only became aware of this paper after publishing a similar study on late Pleistocene flood deposits in the Flinders Ranges, South Australia as part of my PhD thesis, and would like to take this opportunity to give due credit to a study well ahead of it's time.

Riley et al. set out explaining why mineral analysis remains an underutilized diagnostic tool in fluvial geomorphology and sedimentology. Optical microscopy on fine fluvial sediments is cumbersome, statistically questionable and of limited value when it comes to discriminating source areas based on clay mineralogy.

The objective the authors face is to establish the maximum flood level the Nepean/Warragamba Rivers in New South Wales over the recent geological past. The deeply entrenched river terraces in the lower reaches are inappropriate indicators because they represent a different hydrological regime. In the absence of slack water deposits, veneers of alluvium mixed with colluvium by bioturbation remain the only record.

The task was to perform micron-scale textural analysis and discriminate non-fluvial from fluvial material as well as to quantify the sediment contributions from different tributaries in the catchment. Challenges in fingerprinting and provenancing fluvial sediments by mineralogical analysis include sorting and differential comminution during transport, post-depositional weathering, contamination by reworking and aeolian deposition, and mixing of sediments from different source rocks. All this requires a focus on minerals resistant to weathering, and sophisticated statistical analysis of the data.

The methodology section is exceptional. The paper provides detailed information on the QEM*SEM system configuration including a schematic diagram and a technical discussion of the data acquisition and processing in the appendix. The authors developed their own application-specific mineral identification protocol (SIP) and primary mineral lists, differentiating readily identifiable mineral species from broadly related silicate groups. This was at a time when no interactive Measurement Debug module for SIP development was available as in later versions of the iDiscover software package. Unfortunately, it was also before the powerful categorizer tools were developed that provide classification of particles by mineral association, size and shape. As a result, the authors had to make do with modal mineralogy data for 4 physical size fractions. Riley et al. clearly set an example by applying principle component analysis to produce and assess independent variables. The spatial relationship between minerals from different sampling locations was investigated by multiple cluster analysis.

The results are convincing and clearly differentiating fluvial from non-fluvial deposits by QEM*SEM mineralogical data. The conclusion was that the estimate of Probable Maximum Flood discharge for the downstream dam had to be revised. The conclusion after reading this paper is that sedimentologist can clearly benefit from revisiting this pioneering paper before applying the latest image analysis capabilities that compositional mapping solutions such as QEMSCAN provide.

Wednesday, 27 July 2011

TOP 10 AM papers: Grant et al. 1976, Scanning Electron Microscopy/1976 (III)


1982 prototype of QEM*SEM with mini-computer to the right at CSIRO Melbourne

Review of Grant et al. 1976, Scanning Electron Microscopy/1976 (III)

In the 70's, it was not uncommon to publish outstanding geoscientific research in workshop proceedings. This groundbreaking paper on "Multicompositional particle characterization using the SEM-microprobe" by Grant, Hall, Alan Reid and Martin Zuiderwyk is published in the Proceedings of the Workshop on Techniques for Particulate Matter Studies in SEM held at the IIT Research Institute in 1976. Over three decades ago, the authors - listed in alphabetical order - demonstrated the first computer-controlled automated mineralogy system and outlined a number of principle functions in mapping particles which changed little over the years despite the revolution in computational power and software languages since.

Grant et al.'s vision, as outlined in the introduction, is to determine sizes and composition of complex particles, and to "measure rather than infer" areas and perimeters to derive shape functions to better understand physical and chemical behaviors of particles in industrial and mineral treatment processes, i.e. mineral flotation and the degree of liberation during grinding processes.

The original instrument design consists of a mini-computer controlled e-beam which is automatically moved across the sample along a user-defined pattern. An initial "fast scan" locates the particles for detailed scanning. The dwell time for x-ray acquisition at each point can be defined. In addition, an "event acceptance filter" is in place to only record changes in material composition. Composition and e-beam coordinates are saved in form of digital maps composed of line segments and points.

The original system is setup to accept secondary and backscattered electron signals, absorbed specimen current, as well as energy-dispersive x-ray counts from either EDS detectors or microprobe. The measurement mode outlined is a proto-type for what is to become the Particle Mineral Analysis (PMA) in the QEM*SEM and later QEMSCAN solution. It uses either rapid BSE or SE signals to locate the edges of particles which are in turned scanned in detail using x-ray signals. The software includes algorithms linking particles extending across multiple frames, similar to the "field stitch" pre-processor in iDiscover. In addition, mixed signals between particle and mounting medium, referred to as "boundaries" are resolved, a first step in the development of Species Identification Program (SIP) boundary phase definitions and the award-winning "Boundary Phase" pre-processor by Paul Gottlieb in the iDiscover software package. Touching particles are discussed beyond shape parameters using secondary electron images to discriminate same phases in the discussion with reviewers at the end of the paper.

The boundary coordinates are saved allowing for a visual display of the data and basic image analysis functions, including the particle-by-particle calculation of area, perimeter, centroid and even the option to report phase contributions to the perimeter. Particular consideration is given the stereological challenges of reporting unbiased particle size, shape and composition from 2-D data. Interestingly, the authors point out to future investigations in mounting particles onto surfaces and using a second set of detectors providing biaxial views to better estimate particle sizes in three dimensions.

It can be fairly said that the authors laid the foundation for automated mineralogy and future software developments. It is a testimony to their visional capacity that they discus ways to move forward in 3-D particle analysis and even applications of their algorithms beyond rock particles, such as the analysis of pore space or images of macro-scale objects.

Thursday, 14 July 2011

Automated Mineralogy publication trends

Peer-reviewed journal and conference papers on automated mineralogy applications as of mid-2011

There are now >100 papers on automated mineralogy which I have compiled using the open source reference management software Zotero. The library includes book chapters, journal papers, peer-reviewed conference papers, public reports, research thesis, as well as important press releases on automated SEM-based solutions for compositional mapping of minerals and rocks. The bibliographic information is openly accessible via the Internet as a group library with closed membership.

In the process of compiling the literature and organizing the papers by publication type, field of application, as well as analytical technology solution, some interesting trends emerged. The most significant one is a marked increase in automated mineralogy publications over the past couple of years. This year alone, papers published in 2011 or in press account for nearly one third of all automated mineralogy publications.
The two industry-standard automated SEM-EDS solutions QEMSCAN® (formerly QEM*SEM) and the Mineral Liberation Analyzer (MLA) make up the large majority (>90%) of the published literature. This literature is dominated by papers applying QEMSCAN® in areas ranging from oil and gas, coal and flyash, ore characterization, mineral processing optimisation, environmental mineralogy, archaeology and forensics. Papers based on the MLA solution are more focused on the optimization of mineral processing and bright phase mineral detection.

Considering the dominant position of QEMSCAN® in the scientific literature (~80%), it is an interesting exercise to compare the historical stages of QEMSCAN® development with the scientific output. As QEM*SEM (Quantitative Evaluation of Minerals by Scanning Electron Microscopy) was first developed at CSIRO Australia, a limited number of authors lead by the developers such as Alan Reid, Paul Gottlieb, David Sutherland and Alan Butcher laid out the methodological groundwork for early applications. In 2003, when QEM*SEM was turned into a commercial solution by Intellection, publication output picked up by early adopters such as Norman Lotter and Duncan Pirrie, but the overall volume remained low. Scientific writing gathers momentum in 2006, coinciding with the first international meeting to focus on automated mineralogy technologies held in Brisbane: the Automated Mineralogy ’06 conference which was co-organized by MEI and Intellection. The most significant increase in scientific productivity aligns with the acquisition of QEMSCAN and MLA technologies by FEI, a leading developer and provider of scanning electron microscope and focused ion beam solutions.

Friday, 27 May 2011

TOP 10 AM papers: Jackson et al. 1984, Proc. Australas. Inst. Min. Metall. 289, 93-97

QEMSCAN® Sample Blocks
Review of Jackson et al. 1984, Proc. Australas. Inst. Min. Metall. 289, 93-97

The quality of information provided by automated mineralogy solutions, as with any other analytical technique, depends first of all on the quality of the measured sample. It depends on proper sample collection, subsampling procedures, sample preparation and presentation. It is therefore most appropriate to start this review of the Top 10 Automated Mineralogy papers with this classic, although difficult to access, technical note by Jackson, Reid and Wittenberg on "Rapid production of high quality polished sections for automated image analysis of minerals". The 1984 seminal paper on sample preparation describes in great detail a method developed to mount particles for automated mineralogy analysis which remains, with minor adjustments, the standard protocol applied in SEM-EDS laboratories across the world to this day.

The paper starts with laying out the requirements for the production of a representative section mount, so that the mineralogy in the cross-section is representative of the overall parent sample mineralogy. The fundamental requirements are to provide a random, even 3-D distribution of particles, without segregation of particles by mass, density or grain size, or introducing preferential orientation. In addition, a high degree of surface integrity in the sectioned plain needs to be achieved in order to minimise bias introduced by pitting, plucking, grain shattering, or the preferential removal of less competent minerals.

Jackson et al. describe seven steps of sample preparation, including screen sieving, rotary riffling, mechanical dilution, epoxy mounting, grinding, polishing and conductive coating.

1) Screen sieving and/or cyclosizing in an ultrasonic ethanol bath to remove loose aggregation, oversized foreign matter, and provide optimal narrow size ranges for measurement.
2) Random subsampling of the parent material to a few grams is achieved by a rotary riffler.
3) Mechanical dilution of the particle samples is discussed to prevent segregation, minimizes particle-to-particle contact, and to assists random particle orientation. Jackson et al. suggest mixing the sample with crushed graphite of similar size range and surface angularity as an inert filler.
4) Even and random 3-D distribution is achieved by mechanical shaking the mixture in cylindrical plastic moulds. Subsequently, the dry mixture is cast by covering it in resin and hardener and stirring the sample. The epoxy-sample slurry can be evacuated to remove air bubbles.
5) Grinding the hardened block consists of two stages; the first to cut away surface epoxy and particle layers of preferred orientation well into the mixture of particles and filler, the second to remove damaged damage areas.
6) Final polishing with a sequence of diamond paste cloth laps is applied to improve the surface finish. Between grinding and polishing stages, the sample block is cleaned in an ultrasonic bath using a detergent solution or alcohol.
7) Finally, the sectioned sample surface is sputter-coated with a 20-30 nm carbon film making it electro-conductive.

The fundamental sample preparation protocol for automated SEM-EDS analysis laid out by Jackson et al. remains largely unchanged over the past 25 years and is widely applied by the leading service providers in the mining industry.

Friday, 25 March 2011

ICAM 2011 presentation on rock typing of PDC drill cuttings


FEI Australia Center of Excellence for Natural Resources in collaboration with CO2CRC is going to present a third talk at the 10th International Congress for Applied Mineralogy (ICAM 2011) in Trondheim, 1-5 August 2011. Here is a preview of our presentation on a novel lithotyping approach performed on Polycrystalline Diamond Compact (PDC) drill cuttings. Micron-scale compositional mapping, using FEI's QEMSCAN® automated mineralogy solution, and cutting-by-cutting classification by the iDiscover™ software package are demonstrated to provide detailed reservoir rock properties beyond chemical assays and modal mineralogy reports.

Petrological reconstruction of the subsurface based on PDC drill cuttings: an advanced rock typing approach"
by David Haberlah, Pieter W.S.K. Botha, Nicole Dobrzinski, Alan R. Butcher and John G. Kaldi

Polycrystalline Diamond Compact (PDC) drill bits are increasingly used in conjunction with motors and turbines as a fast and cost-effective way to drill wells. However, produced rock cuttings, in particular from clastic reservoir rocks, are often considered too fine and problematic for conventional petrological analysis. Recent advances in automated scanning electron microscopy and energy-dispersive x-ray spectroscopy (SEM-EDS) have transformed the petrological analysis of drill cuttings by replacing conventional qualitative descriptions of handpicked samples, with ultra-fast, quantitative and repeatable petrological analysis. Further developments include moving from chemical and mineralogical whole-rock analysis towards textural characterisation performed on a cutting-by-cutting and mineral grain-by-grain basis. Automated SEM-EDS compositional mapping allows for the definition of rule sets that classify individual cuttings into categories based on parameters such as mineral associations, grain sizes and shapes. As a result, drill cuttings can be classified into lithotypes representing subsurface rock types.

This study demonstrates that accurate and detailed reservoir characterisation can be based on SEM-EDS compositional maps of PDC drill cuttings. Lithofacies associations are reported from rock cuttings at continuous 5 m depth intervals from the CO2CRC’s CRC-1 well for a continuous stratigraphic interval in the Late Cretaceous Skull Creek Fm and Lower Paaratte Fm of the Otway Basin, Victoria, Australia. The CO2CRC Otway Project is the world’s largest research and geological storage demonstration project of the deep geological storage of carbon dioxide (CO2). For each cutting interval, a chemical assay, modal mineralogy report, and corresponding compositional maps were reported. A key advantage of automated SEM-EDS solutions such as QEMSCAN® is that particles can be categorised on the basis of mineralogy, grain size and texture. Here, the drill cuttings were first classified into three general lithotypes, corresponding with sandstone, shale and cemented clasts, and subsequently divided into more specific lithotypes. These provide detailed information on the depositional environment and diagenetic history of the rock formations, and highlight intervals of cementation and intra-formational seals within the reservoir. The lithotyping results were plotted against wireline log data and show a strong correlation with the gamma-ray log.

This study demonstrates that combining automated SEM-EDS measurements of PDC cuttings with advanced digital image analysis and processing, can significantly contribute to the petrological reconstruction of the subsurface. This reinforces drill cuttings are a valuable source of geological and engineering information, potentially reducing the requirements for routine coring and wireline logging.

Wednesday, 16 March 2011

CASANZ 2011 presentation on silica in ambient air


The scientific community and general public are becoming increasingly aware that mineralogy of airborne particulates matters as much as size and shape. The latest paper on this topic will be presented by Anthony Morrison at the 20th Clean Air Society of Australia and New Zealand Conference CASANZ 2011 in Christchurch 5-8th July 2011. It characterises silica and silicon concentrations in ambient air in the vicinity of open cut coal mining operations in the Hunter Valley, New South Wales, Australia. FEI’s automated scanning electron microscopy and energy- dispersive x-ray spectroscopy (SEM-EDS) solution QEMSCAN is used to quantify the proportion of quartz in the particulate matter (PM) samples, identify other silicon containing species for provenance interpretation, and to determine the degree of liberation of quartz in the dust samples.

This study is among the first to apply Automated Mineralogy to the investigation of the public health impacts of airborne particulates to inform the discussion of air quality management plans. It is also pioneering a direct sampling to measurement process, using a Micro Orifice Uniform Deposit Impactor (MOUDI) allowing the dust samples to be collected on polycarbonate discs specially prepared for transferral into the QEMSCAN sample holder. Finally, the study is involving the world’s first attempt at measuring loosely bound particles, thus avoiding sectioning or polishing. The QEMSCAN Particle View screenshot above demonstrates that the surface covered by silt-sized particles is flat enough to be measured.

Have a look at the abstract below and make sure to attend the conference to get a copy of the full paper.

"Quantifying respirable crystalline silica in the ambient air of the Hunter Valley, NSW - sorting the silica from the silicon"
by Anthony Morrison, Peter F. Nelson, Eduard Stelcer, David Cohen, David Haberlah

Crystalline forms of silica are known to cause lung damage for which there is no effective treatment. Silicon is abundant in crustal material and silicates are the single largest mineral grouping, with silica (SiO2) being the most abundant crustal compound. Media reports of high levels of silicon in particles in the air in the vicinity of Hunter Valley open-cut coal mines have caused community anxiety and concerns about potential health impacts on local populations. An extensive sampling campaign using continuous air quality monitoring and targeted collection of particles has been carried out in an area close to mining operations. It was determined that silicon as silica was present in the ambient air, although the concentrations of crystalline silica measured suggest that it should not should cause health problems even for sensitive individuals within the general population. The results of the research should inform more rigorous discussions of air quality management plans for fine particles in the Hunter Valley and aid discussions of community concerns over the potential health impacts of coal mining

Friday, 4 March 2011

ICAM 2011 presentation on hematite and magnetite discrimination

1) optical microscopy, 2) enhanced BSE image, 3) segmentation, 4) MLA classification

FEI Australia Center of Excellence for Natural Resources is going to present a second talk at the 10th International Congress for Applied Mineralogy (ICAM 2011) in Trondheim, 1-5 August 2011. Here is a preview of our talk on a new MLA approach discriminating hematite from magnetite for iron ore characterisation.

"Advanced discrimination of hematite and magnetite by Automated Mineralogy"
by German Figueroa, Kurt Moeller, Michael Buhot, Gerda Gloy and David Haberlah

As the global growth of steel production and consumption continues to accelerate, innovation in the whole industry from iron ore extraction to processing is needed. By providing quantitative and statistically reliable compositional information, automated mineralogy solutions such as the Mineral Liberation Analyser (MLA) have become important tools for characterising iron ore minerals (i.e. hematite, magnetite, goethite and limonite) and their processing products. Although magnetite (Fe3O4) and hematite (Fe2O3) can be easily distinguished qualitatively using optical microscopy, quantitative characterisation by automated scanning electron microscopy/energy-dispersive x-ray spectroscopy (SEM-EDS) is challenging. Hematite and magnetite are chemically close and display similar backscatter electron (BSE) intensities, making discrimination by energy-dispersive X-ray (EDX) spectra alone difficult.

This study presents an automated mineralogy approach discriminating iron oxides by taking full advantage of the subtle difference in backscatter intensities between hematite and magnetite. The advanced workflow involves three steps: 1) Optimisation of measurement parameters increasing the BSE brightness and contrast. In standard MLA operation mode, the BSE brightness is calibrated so that the mounting media (resin) is kept at backscatter brightness values below 15, and gold at a value of 250, covering all common minerals. The modified settings stretch the BSE range for iron oxides from 115-120 to 195-215, effectively doubling the grey level contrast. Two separate modes emerge representing hematite (~200) and magnetite (~208), which can be separated in the image segmentation stage. 2) EDX spectra acquisition combining two measurement settings. Single EDX spectra are collected from geometric centre points of unsaturated segmented phases corresponding to discrete minerals, including hematite and magnetite. Saturated segments, comprising multiple bright mineral phases, are mapped using a regular grid with further phase discrimination based on EDX spectra. 3) Mineral identification is performed by an advanced classification algorithm combining BSE thresholds and EDX spectra.

The new approach is applied to a synthetic sample including particles displaying complex intergrowth between hematite and magnetite, bright sulphide phases, and common gangue minerals. The automated phase-by-phase approach characterises hematite and magnetite reporting quantitative modal composition, mineral association and locking. The results demonstrate that the advanced approach can successfully discriminate iron oxides into hematite and magnetite while at the same time correctly reporting the modal contributions of other phases. Hematite and magnetite are locked as binary phases reflecting intergrowth, and further occur as ternary phases with quartz and feldspar. Locking of the iron oxides can be slightly overestimated without significantly impacting overall results, due to mineral impurities, defects and boundaries with epoxy showing in the BSE image.

In conclusion, an automated SEM-EDS approach is demonstrated to successfully discriminate and quantify hematite and magnetite by advanced mineral identification based on modified backscatter intensities and EDX spectra matching.

Tuesday, 1 March 2011

ICAM 2011 presentation on SEM-EDS mineral identification


Our team at FEI Australia Center of Excellence for Natural Resources is going to present a number of talks at a range of interesting conferences this year. In particular, we will have a strong presence at the 10th International Congress for Applied Mineralogy (ICAM 2011) in Trondheim, 1-5 August 2011. Here is a preview of our talk on a new QEMSCAN protocol for mineral identification using the new Spectral Analysis Engine.

"SEM-EDS based protocol for subsurface drilling mineral identification and petrological classification"
by David Haberlah,Michael Owen, Pieter W.S.K. Botha and Paul Gottlieb

Integrated scanning electron microscopy and energy-dispersive x-ray spectroscopy (SEM-EDS) solutions are widely employed in the mining sector. In subsurface drilling for hydrocarbons, SEM-EDS systems are less common and often only applied to the analysis of thin sections of core samples. Coring wells is more expensive and takes significantly longer than drilling wells. The downside of drilling versus coring is the produced slurry of fine rock cuttings and drilling fluid additives that prove difficult to interpret in terms of rock properties. Thus, drill cuttings are rarely analysed beyond qualitative microscopic descriptions by the mudlogger. Automated SEM-EDS solutions have great potential by providing quantitative cutting-by-cutting data. One difficulty is to develop robust mineral and petrological identification for the cuttings and the drilling mud. Here, we present a fully automated quantitative SEM-EDS based approach, measuring pixels along a predefined grid and comparing measured energy-dispersive x-ray (EDX) spectra with a library of mineral compositions. The analytical protocol is based on the new QEMSCAN® Spectral Analysis Engine (SAE) employing the elemental concentrations method. Mineral phase identification is accomplished by a multi-layered approach using iDiscover™ software v.5.0.

First of all, elemental peak positions and relative intensities from the measured EDX spectra are compared with spectra of elemental standards measured on the same system. The new SAE can perform identification and quantification of up to 72 elements. However, in subsurface drilling applications, the majority of reservoir and seal rock-forming minerals can be adequately discriminated by less than 20 elements. Subsequently, a position-dependent, multi-layered approach to mineral classification is applied. The elemental composition from the measurement point is compared to elemental ranges calculated from synthetic mineral spectra and high-count spectra measured on mineral standards. The elemental ranges are typically based on 100 iterations or more, simulating statistical variability in measured low-count spectra. Variation in the composition of mineral phases and across mineral groups is accounted for by a second layer, merging end-member definitions into single combined mineral (group) expressions (e.g. orthoclase, sanidine, and anorthoclase into alkali feldspars), and by adding common accessory and substitute elements into a “may have” category. Next, the elemental ranges are adjusted interactively on measured samples of known mineral composition. Finally, a few broad definitions trapping poorly defined components such as the mounting medium, inorganic drilling fluid additives, and organic matter can be defined. Once the mineralogical composition of the individual cuttings is fully mapped, they can be further categorised into discrete classes such as rock types. Micro-lithotype classes are based on expressions that take into account textural attributes, such as mineral associations and grain sizes. Rock characteristics of particular interest to reservoir modelling, e.g. the presence of pore-filling cements, can be identified and numerically reported.

Our results suggest that SEM-EDS based mineral identification and petrological classification of drill cuttings can significantly reduce the need for expensive coring, reduce the size of cuttings that can be analysed, and overall improve petroleum reservoir characterisation and modelling efforts. The direct quantitative cutting-by-cutting measurements can also provide an independent means for calibrating gamma ray wireline log data, by reporting the presence of low-potassium clay minerals (i.e. kaolinite and chlorite) in seal formations, and high-potassium feldspars in reservoir rocks.

Tuesday, 7 December 2010

Mapping Apollo 17 lunar regolith

apollo 17 lunar regolith QEMSCAN mineral map

In 1972 Apollo 17 landed on the moon in the Taurus-Littrow Valley on the eastern rim of Mare Serenitatis. Astronauts Gene Cernan and Harrison Schmitt discovered and sampled unusually coloured soil in the form of glass spheres. These spheres occur in a range of colours, from orange to black and green, and in sizes from ten's to hundred's of micron.

Scientists hypothesize that the spheres are the result of fire fountain eruptions that occurred during the same time period as the bulk of mare basalt extrusion, and that they owe their unique colours to a combination of specific chemical compositions, quench crystallization, and devitrification processes.

Automated mineral analysis has allowed the quantification of mineral and glass components, as well as the textural attributes of glass spheres, on a particle-by-particle basis. Researchers can now directly compare samples collected at various locations and draw conclusions on the geological process responsible for the formation of these unique lunar environments.

References:

QEMSCAN mineral map of pisoliths

QEMSCAN cross-sectional images of Pisoliths

The distinctive sub-rounded particles in this image are known as pisoliths, which form at the Earth’s surface as a result of weathering of a rock, typically basalt igneous rock. 
No two pisoliths are the same – although they generally have a nucleus and core which is then surrounded by several concentric layers.


Pisoliths can form a bauxite ore, the main source of aluminium.  
Extraction of aluminium from the ore involves a complex chemical digestion technique known as the Bayer Process. The efficiency of this process s is significantly reduced if impurities other than aluminium hydroxide (green) are present in the ore, such as quartz (pink), clays (brown) and iron oxides (orange) in the image.

FEI’s Automated Mineralogy solutions are helping mining companies better understanding ore variability in terms of mineralogy and textures. QEMSCAN mineral maps as the one above provided by courtesy of BHP Billiton lead to improved metallurgical processing.

Monday, 22 November 2010

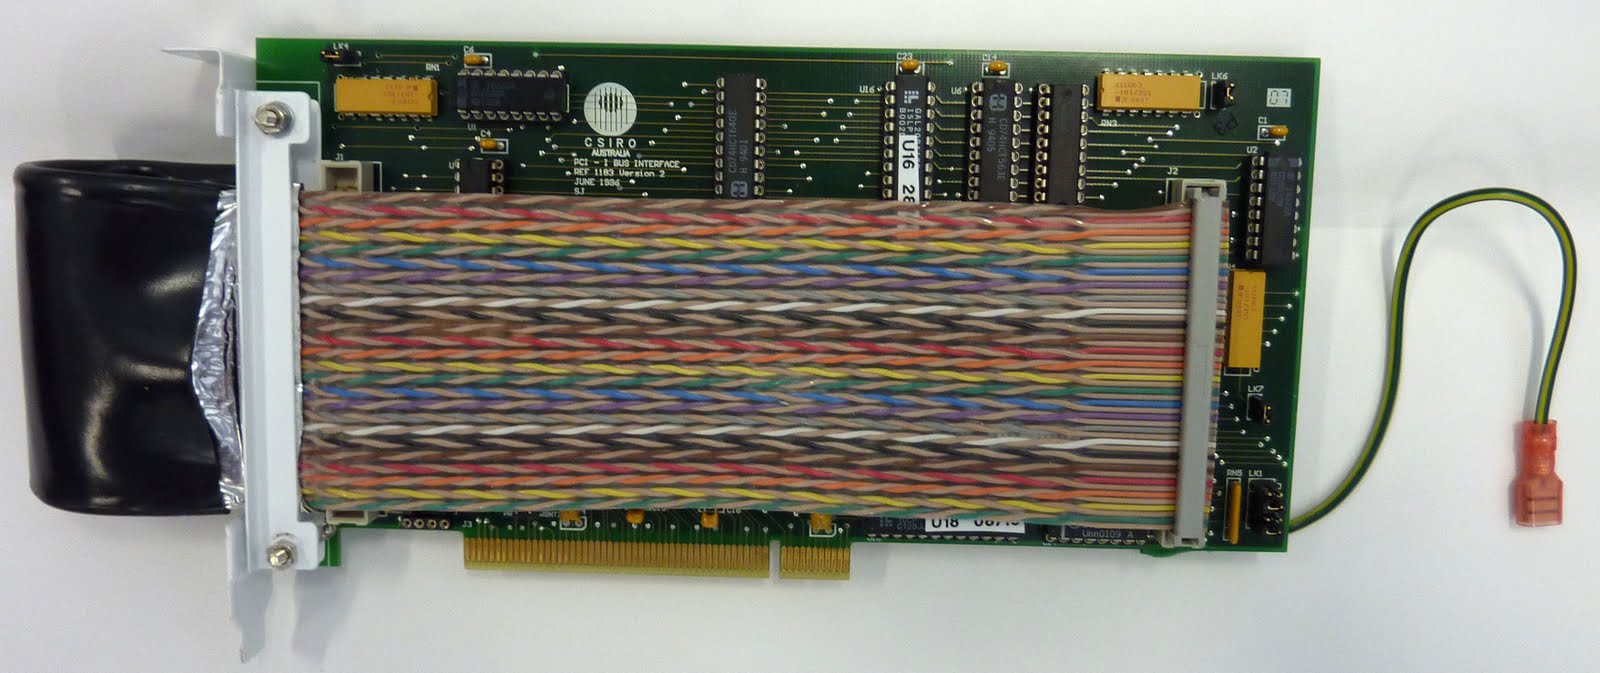
original QEMSCAN hardware interface


Ten years later, The PC PCI-bus hardware interface for the first generation of QEMSCAN was built in 1996.

original QEM*SEM hardware interface


This week, we uncovered a real Automated Mineralogy memorabilia. A VAX Q-bus hardware interface for the original digital QEM*SEM serial # 2. It is a hand-made double-sided printed circuit board built in 1985.

Monday, 15 November 2010

QEMSCAN mineral map of kimberlite


Nothing but a beautiful picture on a Monday morning. This is one of my all time favourite QEMSCAN images: a kimberlite from South Africa donated to Intellection Pty. by De Beers in 2005. The kimberlite mineral map is emphasising olivine macrocrysts (in green) spectacularly altered to various generations of serpentine. The kimberlite matrix is made up of clay minerals and carbonates, presented in blue, purple and buff colours.

Monday, 8 November 2010

FEI Solutions for Natural Resources web launch


Today is a special day for Automated Mineralogy! FEI Australia is launching its first internet presence on Automated Mineralogy solutions for Natural Resources.

Natural Resources Applications are divided into Mining, Oil & Gas, Geosciences and Forensics. Each section serves as an introduction to the field of application and features great images from their QEMSCAN and MLA solutions. Make sure to check out the movie as well!

Hidden away but extremely useful is the Glossary of Natural Resources Terms. Among some 50 related terms, it defines Automated Mineralogy as "A generic term describing a range of analytical solutions, areas of commercial enterprise, and a growing field of scientific research and engineering applications involving largely automated and quantitative analysis of minerals, rocks and man-made materials". Here you go!

A good day indeed to start this blog on Automated Mineralogy, highlighting new applications, reviewing journal papers, pointing out conference presentations and showing off some interesting images. Enjoy!